The Megawatt Map is an interactive data story about how AI computing redraws the world's energy geography. The central thesis: compute used to follow people and fiber — now it follows megawatts. Gigawatt campuses now pair with specific power plants, strain grids, and trigger moratoria across continents.
The world map plots 94 AI campuses, 40 curated hubs and 3,245 large power plants on one megawatt scale. Curved links trace the deals tying tech giants to reactors and turbine fleets — Microsoft to Three Mile Island, Amazon to Susquehanna, Google to modular reactors, xAI to Memphis gas — while rings mark grid strain in Dublin, Singapore, Amsterdam and Northern Virginia. A timeline scrubs 2010→2030; presets contrast 2024 with full build-out.
Beyond the map: an "energy worlds" network of 18 host countries sized by 2030 data-centre demand and colored by grid carbon intensity, and a story view arguing the magnitude shift — 415 to 945 TWh — with a deal-pairing table and carbon ranking.
Stack: Cosmograph engine, Vite front end, Python-stdlib data pipeline.
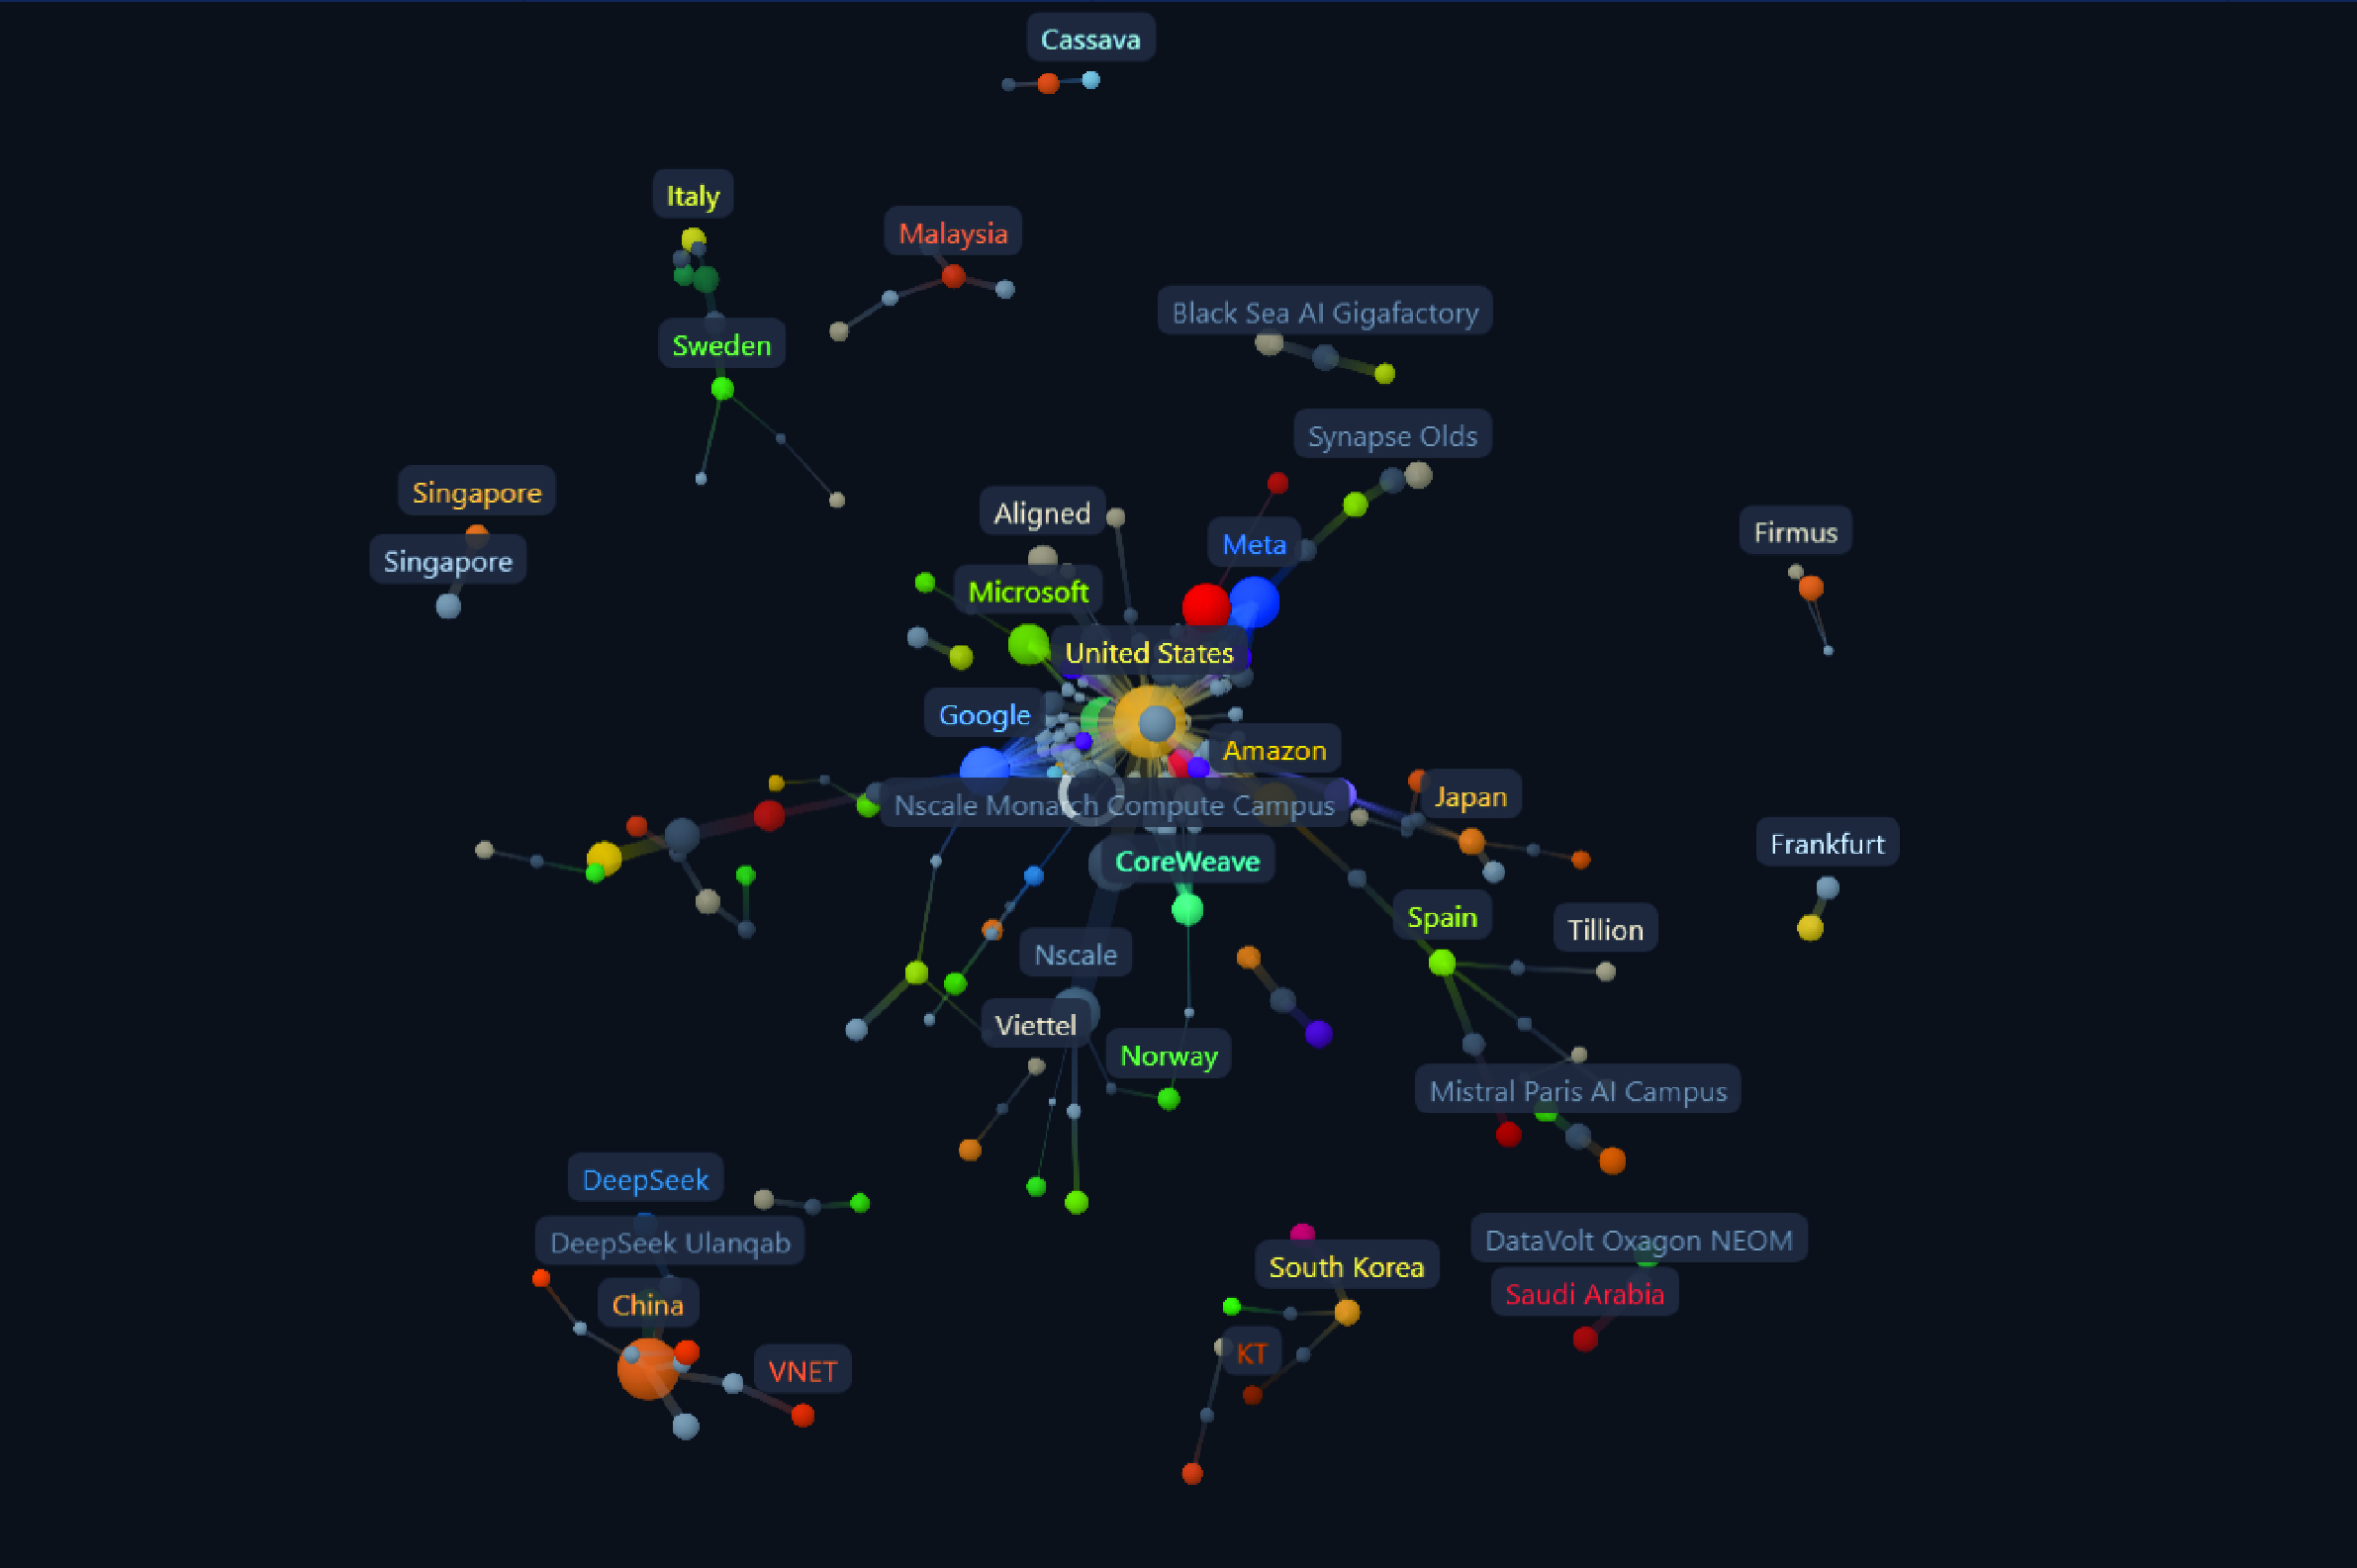
Click the image above to open the application in full screen.
(You will be redirected automatically in 30 seconds)